
The CLTV/CAC Ratio: The Single Most Important SaaS Growth Metric #
TLDR #
This article aims to provide product leaders and managers with a thorough understanding of CLTV/CAC and its actionable insights for product strategy, especially in the context of commercial open-source software. I also ran the numbers for MongoDB as a real-world example.
Customer Lifetime Value (CLTV) #
I’m assuming annual rates for this, but it would also work with monthly or daily rates.
- Customer lifetime value (CLTV) represents the total revenue a business can reasonably expect from a single customer account over the entire relationship. Hence, CLTV = Average Revenue Per Account × Average customer life. E.g., if the average contract value (ACV) is $45K and the median customer lifetime is 4 years, then CLTV = $180K
- Customer Lifetime: The period for which the customer is retained. Hence, customer lifetime = 1 / Define churn rate (Number of Customers Lost in a Period / Total Number of Customers at the Beginning of the Period). For instance, if you know your annual churn is 25%, you can expect the average customer to stay with you for 1/0.25 = 4 years.
- Customer Acquisition Costs (CAC): This is calculated by dividing your company’s total spend on direct sales by the number of customers acquired during the period. So, if you spent $1 million on sales this year and acquired 20 new customers, your Customer Acquisition Cost (CAC) would be $1 million / 20 = $ 50,000 per customer.
- The CLTV/CAC ratio indicates the revenue that will be generated for every dollar spent on acquiring customers. In our example above, this comes out to be $180K/$50K = 3.6
The Power of the CLTV/CAC Ratio #
- Ratio <= 1: This indicates the cost to acquire a customer is higher than the revenue generated over their lifetime, signaling an unsustainable business model. This is NOT good and signals a fundamental problem with scaling — you are losing money for every customer. Even when the business is breaking even on each customer, it is not generating profit. If you factor in operational costs and cost of capital, you are still losing money.
- Ratio > 1: This is where you probably are. Generally accepted healthy ratios are 3:1 or higher, but this varies by industry. Also note that the “ideal” ratio depends on the business’s growth stage and investment strategy.
Estimating it against competitors:
While it would be challenging to obtain customers’ CLTC or CAC numbers, for public companies, you can calculate average ACV by dividing revenue from subscriptions by the estimated number of customers. Similar calculations can be performed for CAC using the company’s balance sheet. I will demonstrate such a calculation using MongoDB’s latest filings.
MongoDB’s CLTV/CAC Ratio #
MongoDB’s latest fiscal results can be found here
https://investors.mongodb.com/2025-Annual-Report-and-Proxy-Statement https://investors.mongodb.com/node/13176/pdf
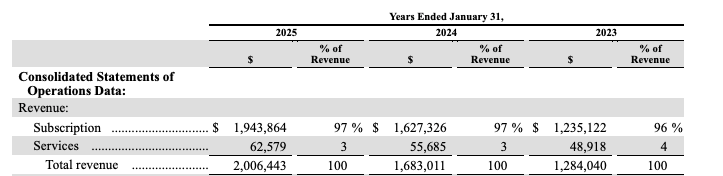
The report states that the revenue from subscriptions is $1.94B, and the report cover indicates that they have over 54,500 customers, so that’s roughly $35,596 per customer. That’s a good first start.
It’s essential to note that MongoDB supports both product-led (MongoDB Atlas) and sales-led approaches, and the numbers associated with each would vary significantly. It’s also fair to assume that the sales-led growth targets larger accounts.
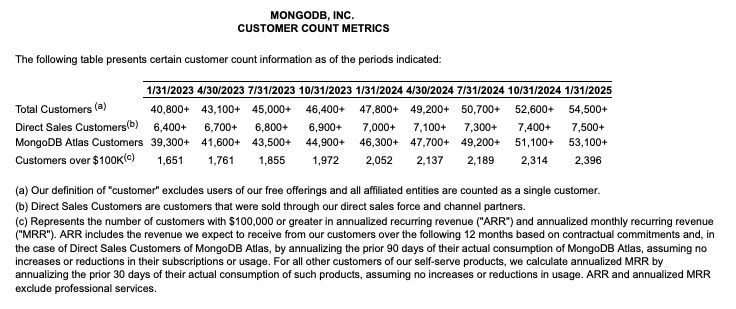
Conveniently, MongoDB does report direct sales customers and their revenue percentage. For the same period as above, they have reported 7,500 direct customers, which account for 88% of subscription revenue. Running the numbers, the average AVC for these 7500 customers turns out to be $1.94B x 0.88 / 7500 = $0.22M per customer. The reason we want to use this number is that it allows us to compare it with the sales-led cost of customer acquisition.
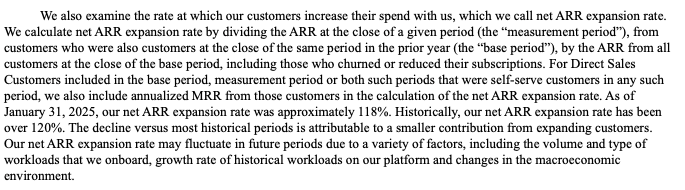
Now, with average ACV, we need the churn rate to calculate CLTV. MongoDB reports (see image below) that the net ARR expansion was roughly 120%, meaning the revenue from existing customers grew by 20% (expansion deals — churn). While this doesn’t directly indicate the churn rate, we can assume the industry average for public SaaS companies’ expansion is around 30–35%, meaning the churn rate would be 10–15%.
So CLTV = 0.22M/0.15 = $1.46M per customer
Now let’s look at the CAC. Sales and marketing costs for 2205 were $161M. Assuming that amount was spent on acquiring 500 customers over the last year (note that this includes churn, hence our CAC will be lower than the actual number), it comes out to be $161M/500 = $0.32M per customer.
Finally, we can examine the CLTV/CAC ratio, which comes out to be $1.46M/$0.32M = 4.5, a very healthy ratio. It’s essential to note that this calculation is performed purely for educational purposes and should not be used to make financial decisions, as the calculations performed make a lot of crude assumptions.
Interpreting CLTV/CAC Ratio #
- High CLTV signifies strong customer retention, effective monetization strategies (upselling, cross-selling), and potentially a strong product-market fit.
- Low CLTV signifies potential issues with customer satisfaction, high churn, ineffective pricing, or limited opportunities for expansion within existing accounts. There may be a need for product improvements, better customer engagement, or pricing adjustments.
- A high CAC indicates inefficient marketing campaigns, a lengthy sales cycle, a lack of product-market fit, or targeting the wrong audience, requiring significant effort to acquire customers.
- Low CAC implies efficient marketing and sales processes, strong organic growth, a highly desirable product, or effective targeting.
Things Product Managers can look at to impact CLTV/CAC ratio
- Prioritizing Features: Utilize CLTV insights to prioritize features that enhance retention (improving lifetime value) or enable upselling or cross-selling (increasing average revenue per account).
- Optimizing Onboarding: Focus on creating a seamless onboarding experience to minimize early churn and maximize the realization of initial value.
- Growth Loops: Design product features that inherently drive acquisition (e.g., referrals, viral sharing).
- Pricing Strategy: Inform pricing decisions based on the perceived value and potential lifetime revenue of customers.
- Understanding Customer Segmentation: Analyze CLTV and CAC across different customer segments to identify the most valuable and cost-effective customer groups. This can inform product roadmap prioritization and the development of targeted features.
Appendix #
I want to acknowledge that MongoDB hasn’t been open-source since October 2018, when it changed its license from AGPL to SSPL. However, it’s still regarded as a major COSS player and hence used, for example, here.
This article was originally published on Medium as part of the BoFOSS publication.